
Water Filter Performance Indicators: A 2026 Consumer Guide
TL;DR:
- Water filter performance indicators include certification standards, measurable contaminant reduction, and sensory signals. Certification under NSF 53 and 372 ensures filters effectively reduce health hazards and contain lead-free materials, providing reliable safety. Observing taste, odor, color, and flow rate helps detect when filters need replacement for optimal protection.
Water filter performance indicators are measurable signals that show how well a filter removes contaminants and protects your health. Most consumers focus on taste and odor, but the real benchmarks go much deeper. Certification standards from NSF International, EPA water quality thresholds, and WHO guidelines define what “effective filtration” actually means. Understanding these indicators helps you choose a filter that does more than improve flavor. It helps you choose one that keeps your family safe.
1. What are the key water filter performance indicators?
Water filter performance indicators fall into three categories: certification standards, measurable reduction metrics, and real-world sensory signals. Each category tells a different part of the story. Certifications confirm lab-verified performance. Metrics give you numbers to compare. Sensory signals tell you what is happening in your home right now.
The industry term for this framework is “filter performance evaluation,” and it covers everything from contaminant reduction rates to filter lifespan assessment. Consumers who understand all three categories make better purchasing decisions and replace filters at the right time. Relying on just one category, like taste alone, leaves critical gaps.
2. Which certification standards matter most for filter safety
NSF/ANSI certification is the most reliable water purification indicator available to consumers. NSF International tests filters independently, publishes results publicly, and requires annual renewal with factory inspections and off-shelf product retesting. That ongoing oversight separates NSF certification from a one-time manufacturer claim.
Here is what each standard covers:
- NSF 42: Covers aesthetic improvements like taste, odor, and chlorine reduction. This is the baseline standard and does not address health-based contaminants.
- NSF 53: The minimum certification for health protection. NSF 53 targets lead, cysts, and volatile organic compounds (VOCs). Consumers often prioritize NSF 42 improvements over NSF 53, which is the more critical standard for safety.
- NSF 58: Applies to reverse osmosis systems and sets the benchmark for total dissolved solids (TDS) reduction.
- NSF 401: Covers emerging contaminants like pharmaceuticals and pesticides not addressed by older standards.
- NSF 372: Certifies that filter components contain no more than 0.25% lead, preventing the filter itself from leaching lead into your water. This is a critical but widely overlooked safety layer.
Always check which specific contaminants a filter is certified to reduce, not just which standard number appears on the box. Two filters can both carry NSF 53 certification but target completely different contaminants within that standard.
Pro Tip: Look for filters certified under both NSF 53 and NSF 372. NSF 372 complements NSF 53 by confirming the filter materials themselves are lead-free, not just the water passing through.
3. What measurable benchmarks reveal filter efficiency
Quantitative filter performance benchmarks give you a concrete way to compare filters before you buy. The most important numbers involve lead reduction, TDS reduction, and bacterial compliance thresholds.

NSF 53-certified filters achieve a 99% success rate in reducing lead to safe levels. Uncertified filters manage only 61%. That 38-percentage-point gap represents a meaningful health risk, not a minor performance difference.
For reverse osmosis systems, NSF 58 requires a minimum 75% TDS reduction. Certified systems typically achieve 90–96% in lab conditions. TDS reduction matters because high dissolved solids can affect taste and indicate the presence of minerals, salts, and other compounds.
On the bacterial side, the EPA’s Clean Water Act sets a clear threshold: more than 5% of monthly water samples containing coliform bacteria signals non-compliance for public water systems. That standard gives consumers a reference point for understanding what “safe” bacterial levels look like.
| Benchmark | Standard | Typical Certified Performance |
|---|---|---|
| Lead reduction | NSF 53 | 99% success rate |
| TDS reduction (RO) | NSF 58 | 90–96% |
| Coliform compliance | EPA Clean Water Act | Less than 5% monthly samples |
| Lead-free materials | NSF 372 | Max 0.25% lead in components |
Filter capacity ratings deserve special attention. Rated gallon capacity is a lab estimate, not a guaranteed real-world figure. Your actual capacity depends on your local water quality, flow rate, and contaminant concentration. A filter rated for 100 gallons in a lab may perform differently in a home with hard water or high chlorine levels.
Pro Tip: Real-world conditions consistently produce lower capacity than lab ratings. Treat the gallon rating as a ceiling, not a target, and watch for sensory changes well before you reach it.
4. Visible and sensory signs your filter is working or failing
Your senses are the most immediate water filter effectiveness measures available. Changes in taste, odor, color, and flow rate all signal something about filter condition. Knowing what to watch for prevents contaminant breakthrough from going unnoticed.
Key sensory signals to monitor:
- Return of chlorine taste or smell: Chlorine odor returning to filtered water means the filter media is saturated and no longer absorbing effectively.
- Metallic or earthy taste: These flavors can indicate that the filter is no longer capturing the compounds responsible for them, or that new contaminants have entered your supply.
- Discoloration: Yellow, brown, or cloudy water from a filtered tap suggests sediment breakthrough or filter media degradation.
- Reduced flow rate: A significant drop in water pressure through the filter indicates clogging or fouling. The filter is working harder but delivering less.
- Filter change indicators (PIDs): Performance indication devices built into some filters change color or signal electronically when replacement is due. These are useful but should not replace sensory monitoring.
Waiting until the maximum gallon rating before replacing a filter is a common mistake. Observable changes in flow, taste, or color are more reliable real-world replacement signals than a gallon counter. Proper filter maintenance keeps performance consistent between replacements.
5. How testing protocols shape what performance numbers actually mean
Filter performance data is only as reliable as the conditions under which it was generated. Water pH, contaminant concentration, and flow rate all significantly influence filter effectiveness, even among filters with identical designs. Two filters tested under different protocols can produce very different results.
“Long-term stability and test protocol transparency provide a more trustworthy performance picture than initial filter claims alone. A filter that performs well at the start of its rated life but degrades quickly offers far less real-world value than one with consistent, verified performance across its full capacity.”
Filter architecture and media type matter as much as the number of filtration stages. Contact time between water and filter media is the critical driver of contaminant removal. A well-designed single-stage filter with adequate contact time consistently outperforms a poorly designed multi-stage system. An NSF 53-certified 3-stage filter regularly outperforms more complex uncertified filters, which confirms that certification and design predict performance better than stage count.
When evaluating filter claims, ask whether the manufacturer publishes the test conditions used. Reputable brands disclose pH levels, flow rates, and contaminant concentrations used in testing. Brands that only publish reduction percentages without test conditions are giving you an incomplete picture.
6. Practical tips to maximize filter performance and read quality indicators accurately
Getting the most from your filter requires more than buying a certified product. Installation, maintenance, and matching your filter to your local water supply all affect whether you achieve the performance the certification promises.
Best practices for consistent filter performance:
- Combine certifications for full coverage. A filter certified under NSF 42, NSF 53, and NSF 372 together addresses aesthetic quality, health-based contaminants, and lead-free materials. No single certification covers everything.
- Match your filter to your water supply. Request your municipality’s annual water quality report. It lists the specific contaminants detected in your local supply. Then confirm your filter is certified to reduce those exact contaminants.
- Do not rely on stage count as a quality signal. More filtration stages do not guarantee better performance. Certification and media quality are the reliable indicators.
- Replace filters before sensory changes become severe. Early replacement based on flow reduction or faint odor return protects performance. Waiting for obvious taste problems means contaminants may already be passing through.
- Follow installation instructions precisely. Improper installation reduces contact time between water and media, which directly lowers contaminant removal efficiency.
Pro Tip: Your local water quality report is free and available from your water utility. Cross-referencing it with your filter’s certified contaminant list is the most direct way to confirm your filter addresses your actual risks. Consumers with sensitive skin concerns should pay particular attention to chlorine and heavy metal certifications.
Choosing filters that align with non-toxic personal care practices makes sense for health-conscious consumers who are already reducing chemical exposure in other areas of their routine.
Key Takeaways
Certification under NSF 53 and NSF 372, combined with sensory monitoring and protocol-aware evaluation, gives consumers the most complete picture of water filter performance.
| Point | Details |
|---|---|
| Certification over stage count | NSF 53 certification predicts health protection better than the number of filtration stages. |
| NSF 372 prevents filter contamination | Filters without NSF 372 can leach lead into water even while reducing other contaminants. |
| Gallon ratings are lab estimates | Real-world capacity is lower; replace filters based on sensory signals, not just gallon counts. |
| Test protocol transparency matters | Published test conditions make performance claims credible; absent conditions are a red flag. |
| Match filter to local water report | Your municipal water quality report identifies the specific contaminants your filter must address. |
What I’ve learned after years of watching consumers choose the wrong filter
Most people buy a water filter based on the number of stages or a vague claim about “pure water.” I’ve watched this pattern repeat constantly, and the result is almost always the same: a filter that improves taste but does nothing meaningful for health protection.
The uncomfortable truth is that NSF 53 certification is the minimum bar for health safety, yet most marketing leads with NSF 42 benefits because taste and odor improvements are easier to sell. Consumers feel the difference immediately. Lead reduction is invisible, which makes it easy to deprioritize.
Independent certification is the only real trust signal in this category. Surprise factory inspections and off-shelf retesting mean a certified filter performs consistently, not just on launch day. I would never recommend a filter that cannot show current, specific certification documentation.
The other thing most articles miss: your filter’s performance is only as good as your installation and maintenance. A certified filter installed incorrectly or run past its real-world capacity provides false confidence. The sensory indicators, flow rate, odor, and taste, are your early warning system. Use them. Understanding how filtered water affects your skin also reinforces why consistent filter performance matters beyond just drinking water.
— Sara
Vitacleanhq’s approach to verified filtration performance
Vitacleanhq builds its product line around the performance indicators covered in this guide. The focus is on filters that target health-based contaminants, not just aesthetic improvements, which aligns directly with the NSF 53 and NSF 372 standards that matter most for safety.
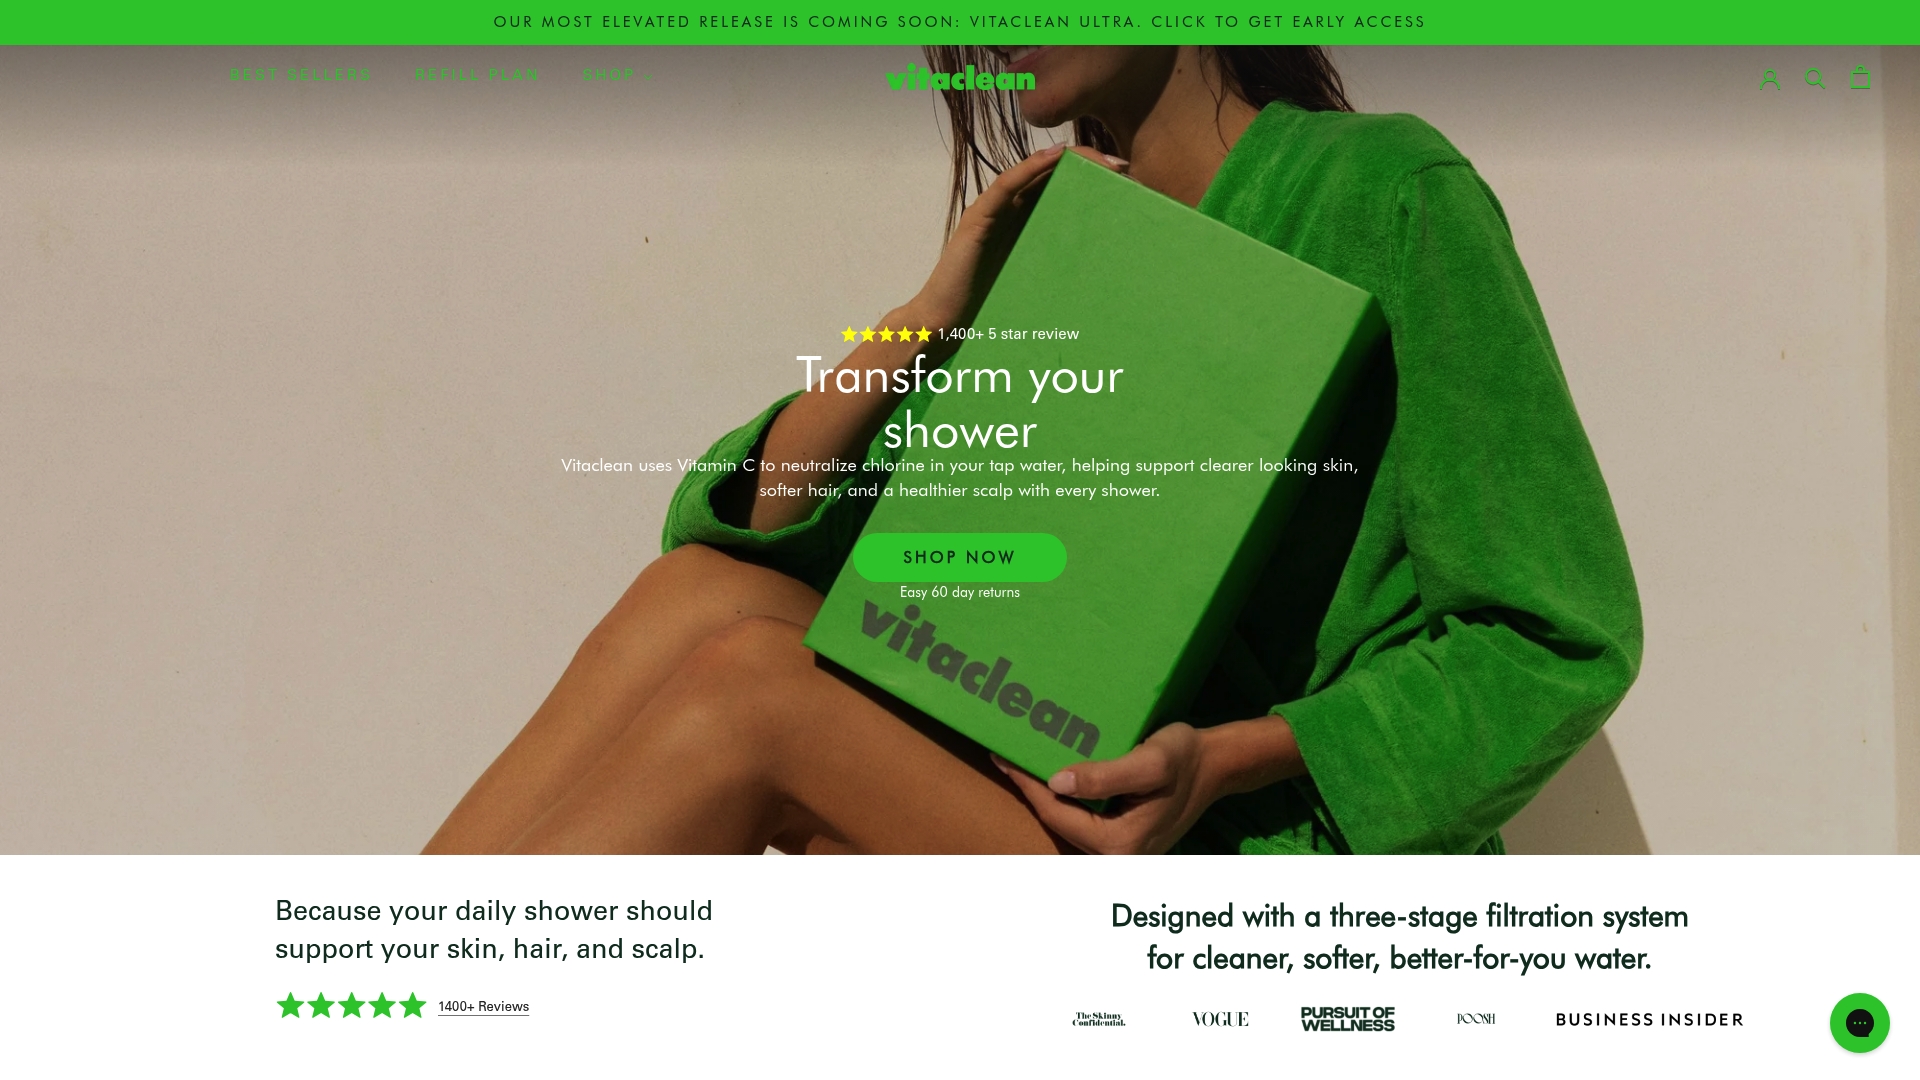
The Vitamin C shower filter shots neutralize chlorine and reduce impurities that affect skin and hair health. The ceramic filter range offers proven filtration efficiency for consumers who want consistent, long-term performance. Vitacleanhq also offers a filter refill subscription that removes the guesswork from replacement timing, keeping your filter performing within its certified range without the need to track gallons manually.
FAQ
What does NSF 53 certification mean for a water filter?
NSF 53 certifies that a filter reduces health-based contaminants including lead, cysts, and VOCs to safe levels. Filters with this certification achieve a 99% lead reduction success rate, compared to 61% for uncertified filters.
How do I know when to replace my water filter?
Replace your filter when you notice a return of chlorine odor, metallic taste, discoloration, or a drop in flow rate. These sensory signals are more reliable replacement triggers than reaching a rated gallon limit.
What is TDS reduction and why does it matter?
TDS stands for total dissolved solids, and it measures the concentration of dissolved compounds in water. NSF 58-certified reverse osmosis systems reduce TDS by 90–96%, which improves taste and removes dissolved minerals and salts.
Is a filter with more stages always better?
No. An NSF 53-certified 3-stage filter consistently outperforms more complex uncertified systems. Contact time between water and filter media drives’ contaminant removal, not the number of stages.
What is NSF 372 and why should I care about it?
NSF 372 certifies that filter components contain no more than 0.25% lead, preventing the filter itself from adding lead to your water. Without NSF 372, a filter could reduce waterborne lead while simultaneously leaching lead from its own materials.